


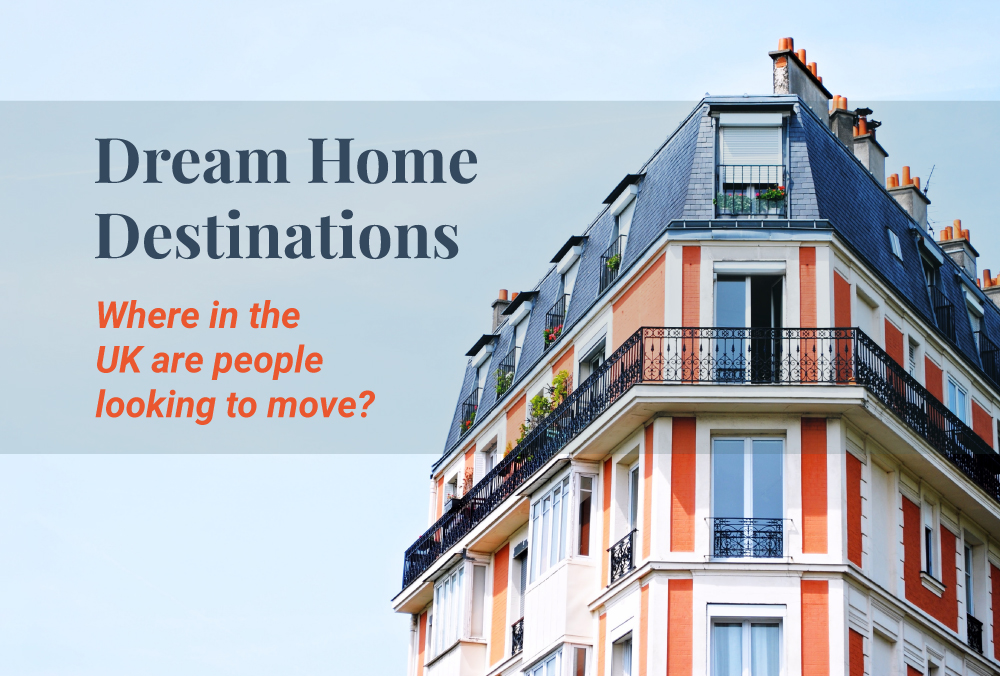
Dream Home Destinations
Where in the UK are people looking to move?
Many factors impact house prices, such as economic indicators and the local market, all of which contribute to the constant fluctuation of property values.
It isn’t just economic factors which can have an effect on the value of your home. Building features such natural stone tiles could increase your property value or more efficient additions such as underfloor heating and solar panels, can increase demand for your home.
Another factor that affects prices is the location of the property. The same house located in a different town or city could be worth wildly different amounts. Living in certain places is a much more desirable prospect for potential buyers, but which UK destinations are currently on the rise?
By looking at the towns and cities where house prices have risen the most in recent years, we have been able to identify the towns and cities becoming more desirable. Moreover, we have looked at Google search data to discover where the public interest in buying a property has grown the most.
Towns and cities with the biggest increase in house prices
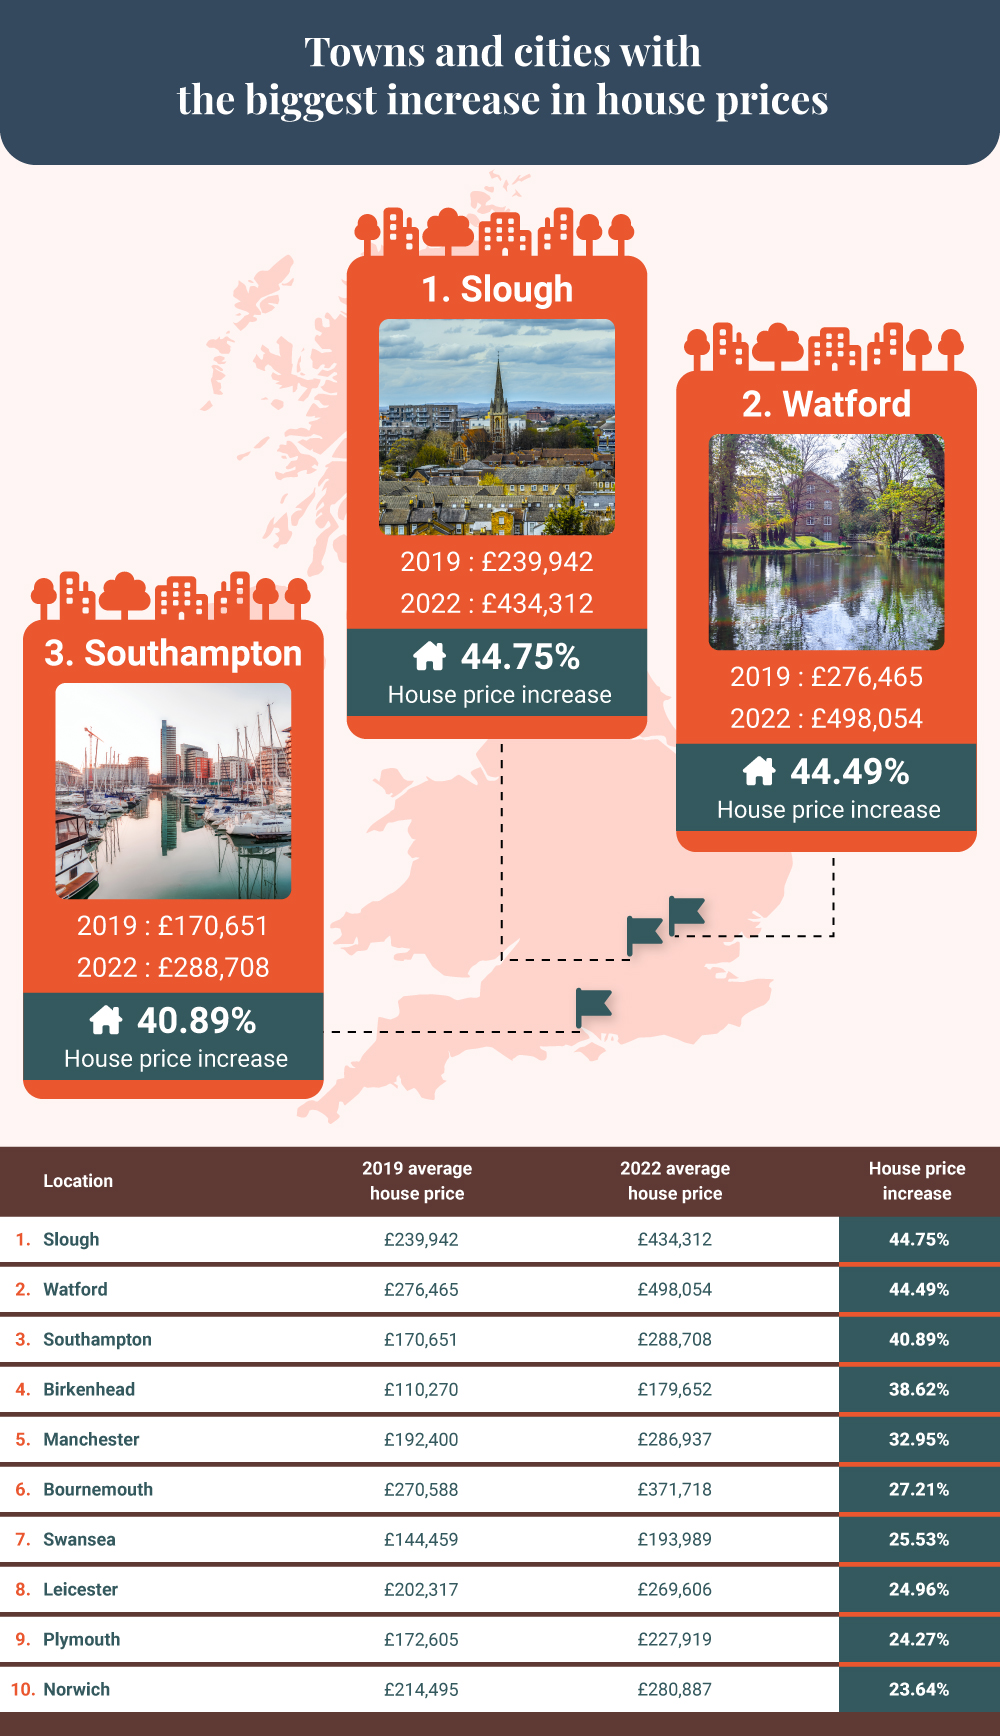
1 – Slough
2019 Average House Price: £239,942
2022 Average House Price: £434,312
House price increase: 44.75%
Slough is an area that is becoming much more desirable to live in. During the last three years, the average house price has almost risen by half. House prices three years ago were just under £240,000 (the sixteenth most expensive in the country), today they are the sixth most expensive at over £430,000. One reason Slough is becoming an increasingly attractive home destination is the number of jobs in the town, as there are more company HQs there than anywhere else outside of London.
2 – Watford
2019 Average House Price: £276,465
2022 Average House Price: £498,054
House price increase: 44.49%
Watford, another town just outside of the capital, is also seeing an increase in house prices by 44.49%. Just like Slough, Watford is growing due to it being a convenient and cheaper location for people who work in London to live and commute into the city.
3 – Southampton
2019 Average House Price: £170,651
2022 Average House Price: £288,708
House price increase: 40.89%
Another destination which has seen house prices rise by over 40% is Southampton. The South Coast port city saw its house prices rise from just over £170,000 to almost £290,000 today. One reason for the rise in Southampton is a lack of availability, as there is more demand than properties on the market.
Towns and cities with the most expensive houses
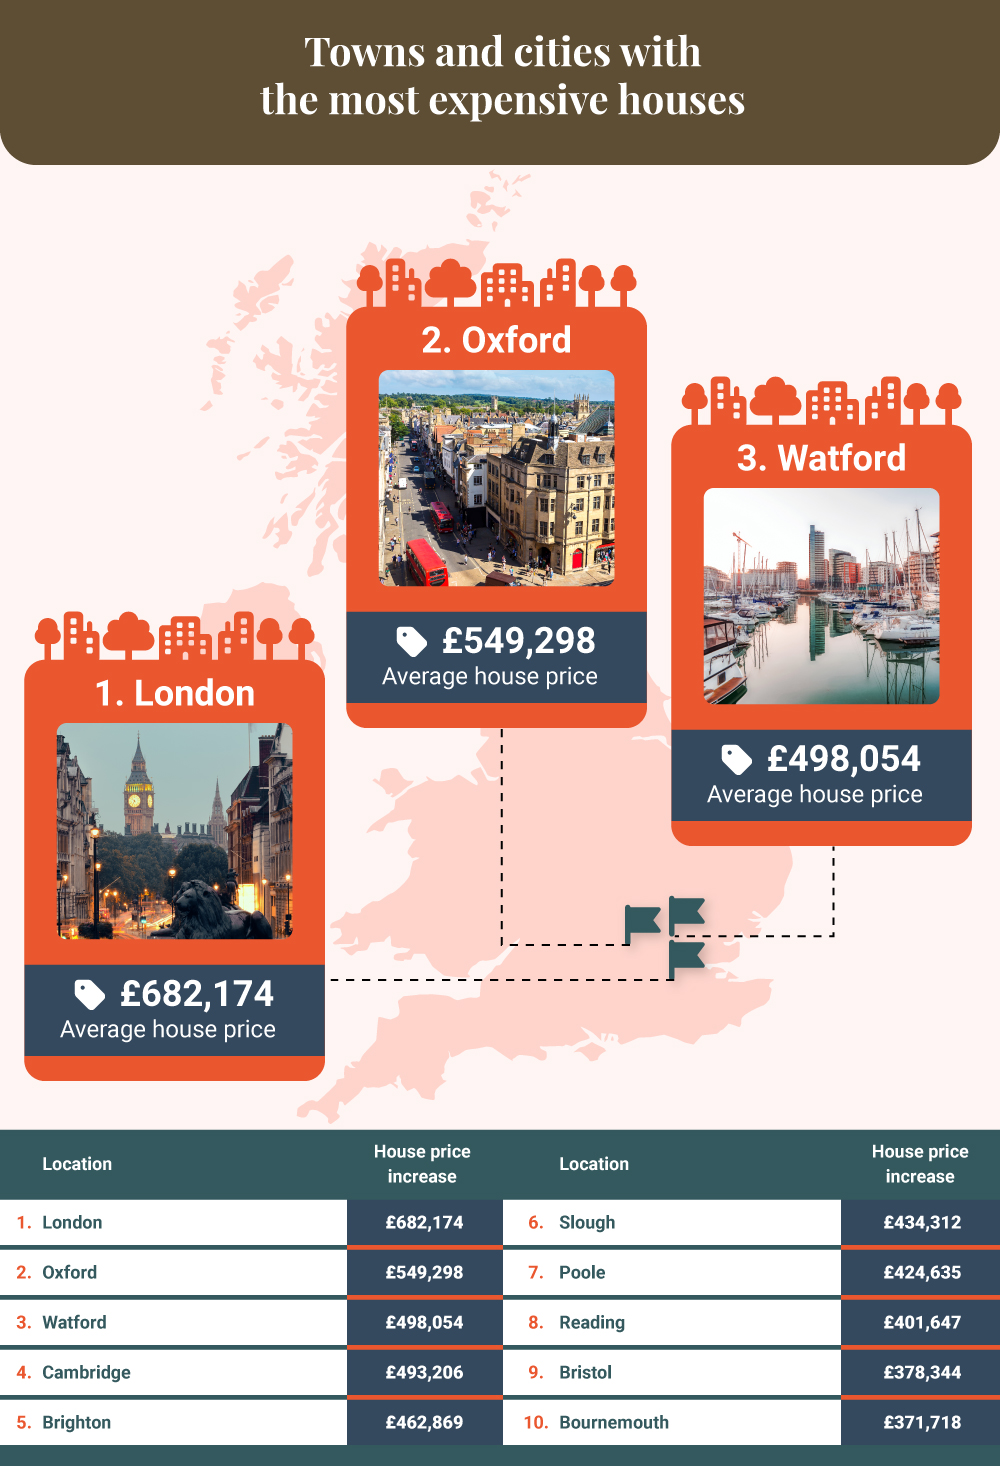
1 – London, average house price of £682,174:
London is still the most desirable dream home destination in the country as it has, by far, the most expensive average house prices. It is over £130,000 more expensive on average to buy in London than in any other major town or city in the United Kingdom.
2 – Oxford, average house price of £549,298
Oxford is a historic city known for its beautiful architecture, much of which is centred around its world-famous university. Living in Oxford is not cheap though, to become a homeowner in the city you will need to rustle up almost £550,000 on average.
3 – Watford, average house price of £498,054
As mentioned above, house prices in Watford are rising faster than in almost any other major town or city in the country. Watford now has the third highest average house price of them all, costing just under £500,000 on average.
Towns and cities where property interest has increased the most
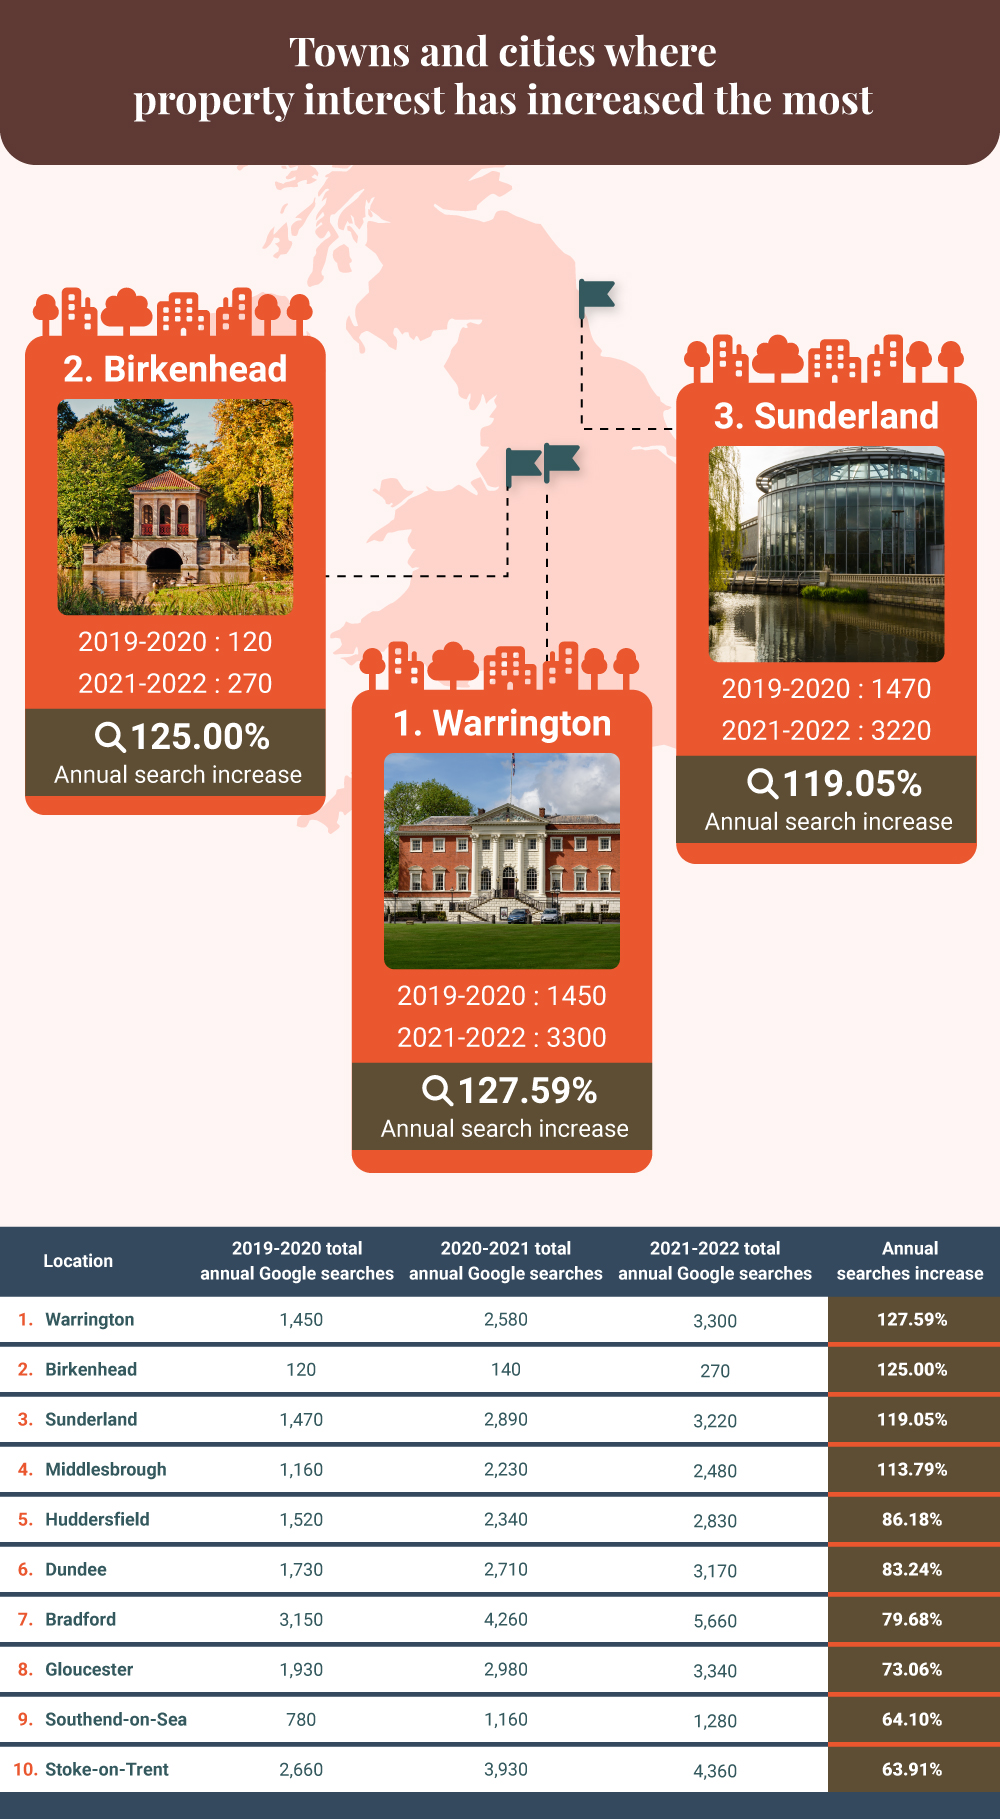
1 – Warrington
2019-2020 total annual Google searches: 1,450
2021-2022 total annual Google searches: 3,300
Annual searches increase: 127.59%
Warrington is a town in the north of England famous for its historic industrial importance, and its famous Rugby League team, the Wolves. Interest in buying property in Warrington has increased dramatically online during the past three years, as Google searches rose by almost 130%.
2 – Birkenhead
2019-2020 total annual Google searches: 120
2021-2022 total annual Google searches: 270
Annual searches increase: 125%
Another location on the banks of the River Mersey ranks just behind Warrington. Birkenhead saw a 125% three-year increase in the volume of Google searches for house prices in the area. With excellent transport links to Liverpool by boat, it is easy to live across the river in cheaper Birkenhead whilst working in the city, which could be a factor in the rising interest.
3 – Sunderland
2019-2020 total annual Google searches: 1,470
2021-2022 total annual Google searches: 3,220
Annual searches increase: 119.05%
From the North West coast to the North East, Sunderland has seen the third-highest increase in Google searches during the past three years. During the recent scorching summers, the beaches of Sunderland have been enjoyed by thousands, and it seems the seaside lifestyle is attracting homeowning interest.
Towns and cities with the most property value searches
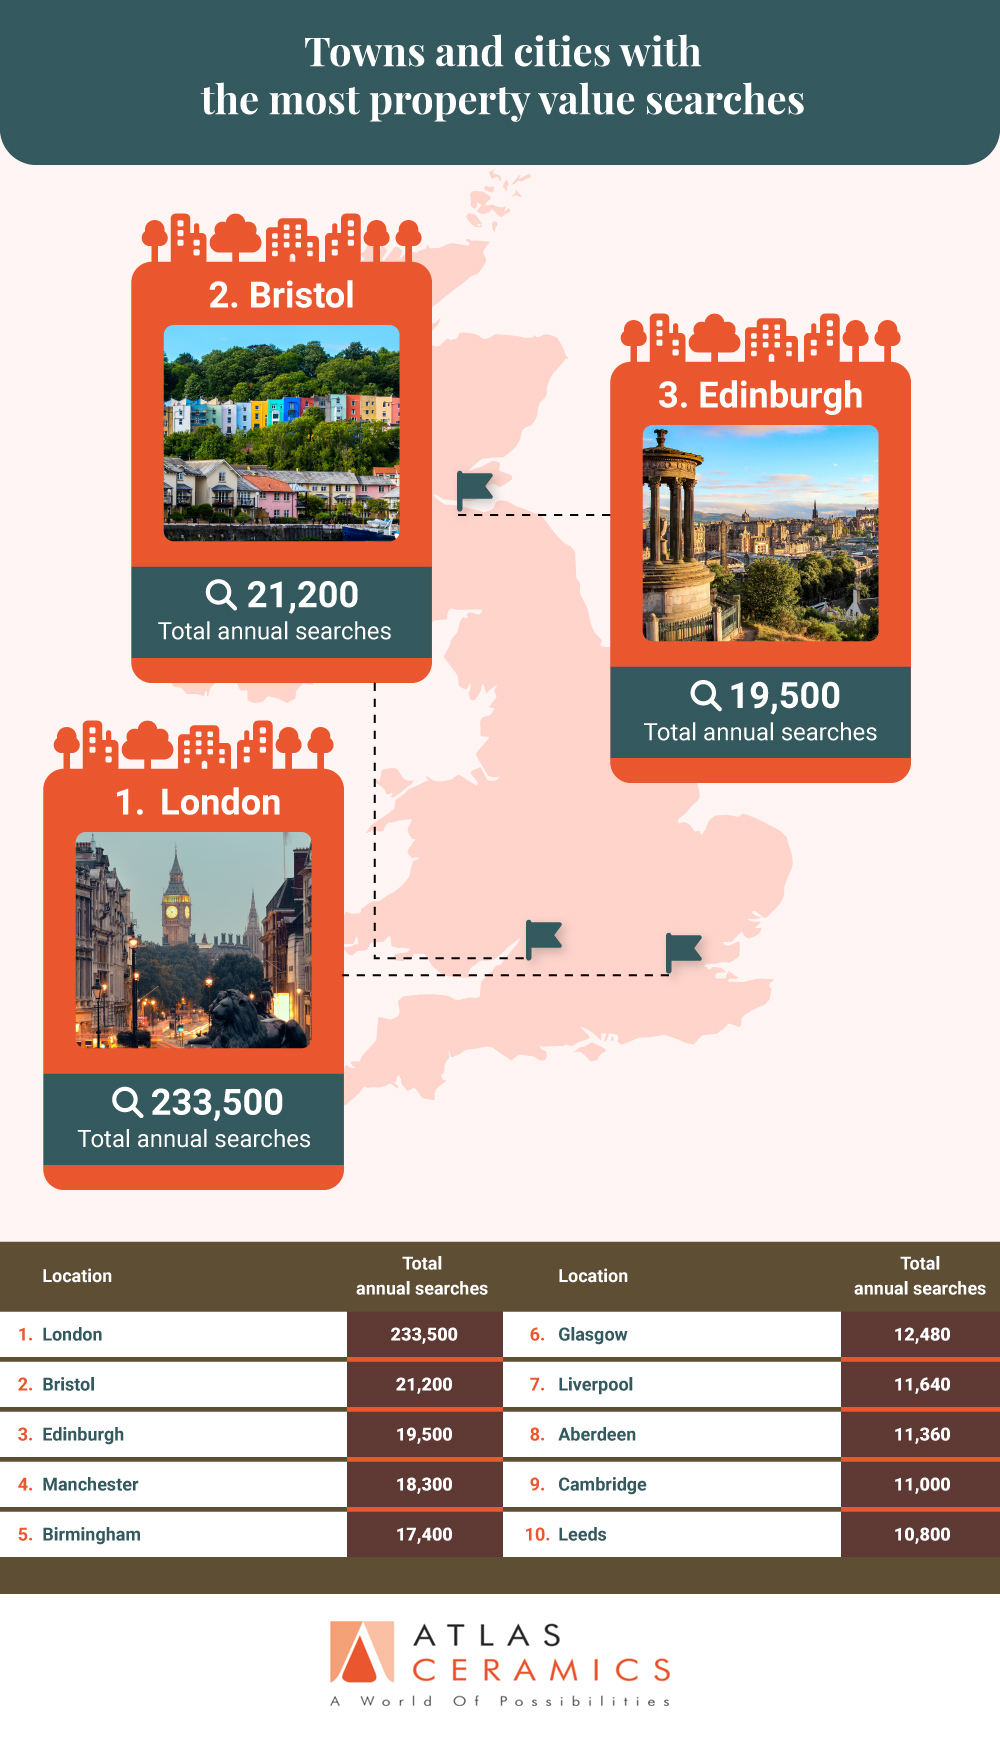
1 – London, 233,500 total annual searches:
By a monumental amount, Google searches for house prices in London are higher than in any other major town or city in the country. There were more than ten times as many searches for London as second-placed Bristol achieved.
2 – Bristol, 21,200 total annual searches:
The second highest number of Google searches for house prices in a city was in Bristol, the western city had over 20,000 annual searches. Living in Bristol gives you great views such as the Clifton suspension bridge, and a lot going on in the UK’s fifth biggest city.
3 – Edinburgh, 19,500 total annual searches:
Scotland’s capital city came third in the rankings, there were just under 20,000 searches for house prices in Edinburgh, which meant there were over 7,000 more searches than there were for houses in Glasgow.
Methodology
- A list of the 50 biggest UK towns and cities by population was compiled.
- Any towns and cities where full data couldn’t be found were removed and replaced with the next most populous.
- Current house price data was sourced from Rightmove, for some data could not be found and Zoopla was used instead.
- We used Wayback Machine to discover the house price three years ago (or the nearest date to three years ago), to see how prices had changed.
- Google Ads Keyword Planner was used to find the total number of searches for ‘location house prices’. We then calculated the difference in searches between years.